How to Calculate Average: Mean, Median & Mode Explained
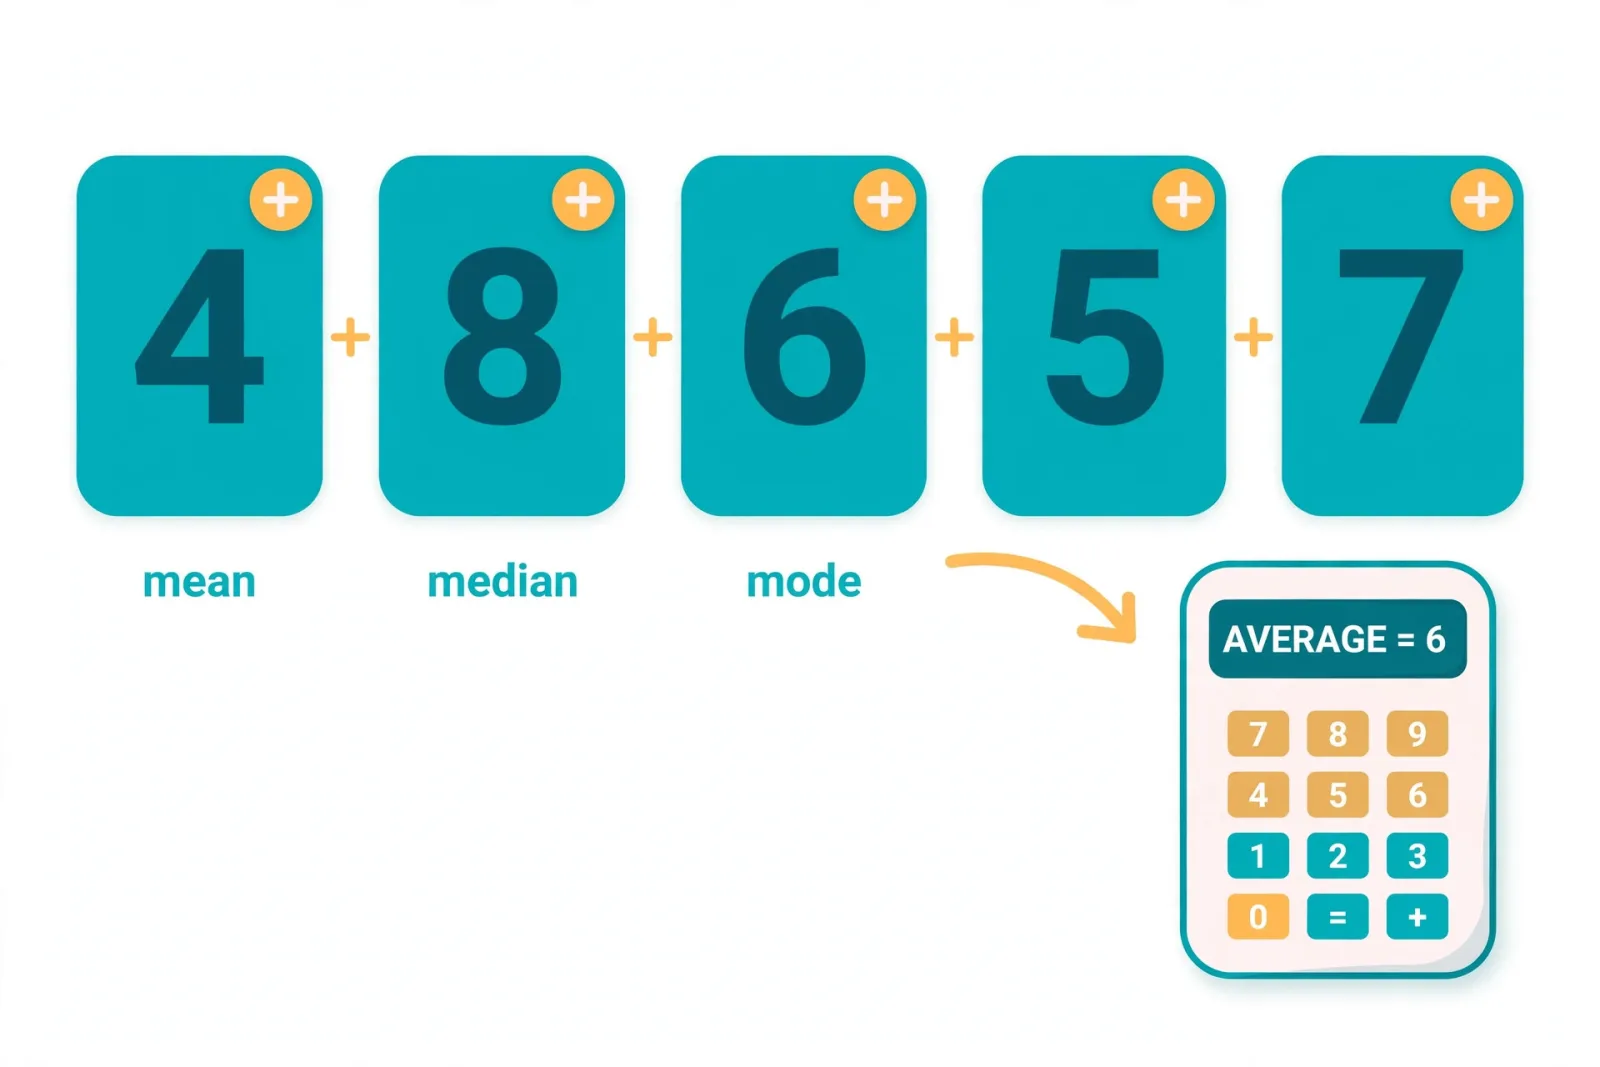
Add up all the numbers and divide by how many there are. Example: for 4, 8, 6, 5, 7 → (4 + 8 + 6 + 5 + 7) ÷ 5 = 30 ÷ 5 = 6. That is the mean, the most common type of average.
On this page
The Short Answer
When most people say "average," they mean the mean: add up all the values and divide by the count of values.
Mean = (sum of all values) ÷ (number of values)
Take the numbers 4, 8, 6, 5, and 7. Add them: 4 + 8 + 6 + 5 + 7 = 30. Count them: 5 numbers. Divide: 30 ÷ 5 = 6. The average is 6.
But "average" actually covers three different ideas — the mean, the median, and the mode — and picking the wrong one can quietly mislead you. Below you will find step-by-step methods for all three, worked examples you can check by hand, the classic situations where each one is the right tool, and the mistakes that trip almost everyone up the first time.
What "Average" Really Means
In everyday speech, "average" usually means the mean. In statistics, it is an umbrella term for a measure of central tendency — a single number that summarizes where the middle of a dataset sits. The three standard measures are:
- Mean — the arithmetic average: total divided by count.
- Median — the middle value when the data is sorted.
- Mode — the value that appears most often.
They usually agree on tidy datasets and disagree wildly on messy ones. Knowing which one someone quoted — and which one they should have quoted — is the whole game.
Method 1: The Mean (Arithmetic Average)
Three steps, nothing more:
Step 1 — Add up all the values. This total is called the sum.
Step 2 — Count how many values there are. This is n.
Step 3 — Divide the sum by the count.
Formula: Mean = Σx ÷ n (Σx means "sum of all x values").
Worked Example 1: 4, 8, 6, 5, 7
- Sum: 4 + 8 + 6 + 5 + 7 = 30
- Count: 5
- Mean: 30 ÷ 5 = 6 ✓
Worked Example 2: Test scores 82, 90, 76, 88, 94
- Sum: 82 + 90 + 76 + 88 + 94 = 430
- Count: 5
- Mean: 430 ÷ 5 = 86 ✓ — an 86 average.
Worked Example 3: With decimals — 2.5, 3.0, 4.5
- Sum: 2.5 + 3.0 + 4.5 = 10.0
- Count: 3
- Mean: 10 ÷ 3 = 3.333… → 3.33 ✓
The mean uses every value, which is its strength and its weakness: a single extreme outlier can drag it far from the "typical" value, as you will see below.
Method 2: The Median (Middle Value)
The median is the value sitting exactly in the middle once the data is sorted from smallest to largest.
- Odd count: the median is the single middle number.
- Even count: the median is the average of the two middle numbers.
Worked Example 1: Odd count — 3, 1, 7, 5, 9
- Sort: 1, 3, 5, 7, 9
- Middle value (3rd of 5): 5 ✓
Worked Example 2: Even count — 10, 4, 8, 2
- Sort: 2, 4, 8, 10
- Two middle values: 4 and 8
- Median: (4 + 8) ÷ 2 = 6 ✓
Worked Example 3: Why the median matters — salaries
Five salaries: $30,000, $35,000, $40,000, $45,000, and $1,000,000 (the CEO).
- Mean: (30,000 + 35,000 + 40,000 + 45,000 + 1,000,000) ÷ 5 = 1,150,000 ÷ 5 = $230,000
- Median: the middle of the sorted list = $40,000
The mean says the "average" salary is $230,000 — technically true, practically absurd. The median ($40,000) describes what a typical employee actually earns. This is exactly why income statistics are almost always reported as medians.
Method 3: The Mode (Most Frequent Value)
The mode is simply the value that shows up most often. No arithmetic required — just counting.
Worked Example 1: 2, 4, 4, 4, 6, 8
- 4 appears three times — more than any other value.
- Mode: 4 ✓
Worked Example 2: Bimodal — 1, 2, 2, 3, 3, 4
- 2 appears twice; 3 appears twice; nothing appears more.
- Modes: 2 and 3 — the data is bimodal ✓
Worked Example 3: No mode — 1, 2, 3, 4
- Every value appears exactly once.
- There is no mode ✓
The mode shines with categories rather than numbers: the most common shoe size sold, the most popular answer in a survey, the busiest day of the week. Means and medians cannot do that job at all.
Mean vs Median vs Mode: Which One Should You Use?
Use this decision guide:
| Situation | Best choice | Why |
|---|---|---|
| Data is symmetric, no extreme values (test scores, heights) | Mean | Uses all the data; the familiar "average" |
| Data has outliers or is skewed (incomes, house prices) | Median | Outliers barely move it |
| You need the most common category (sizes, votes, ratings) | Mode | The only one that works on non-numeric data |
| Every value counts equally and you want the total's center | Mean | It is literally total ÷ count |
A quick rule of thumb: if removing the biggest and smallest values would change the answer a lot, the median is probably the honest choice.
The Weighted Average
Sometimes values do not count equally. A final exam might count more than a homework assignment — that calls for a weighted average: multiply each value by its weight, add those products, and divide by the total weight.
Weighted average = (value₁ × weight₁ + value₂ × weight₂ + …) ÷ (weight₁ + weight₂ + …)
Worked Example: Course grade
Homework: 85 (weight 20%), Quizzes: 90 (weight 30%), Final exam: 78 (weight 50%).
- 85 × 0.20 = 17
- 90 × 0.30 = 27
- 78 × 0.50 = 39
- Total: 17 + 27 + 39 = 83 ✓
The plain mean of 85, 90, 78 would be 84.3 — but the exam-heavy weighting pulls the real grade down to 83. If the weights are percentages that add to 100%, you can skip the final division, as above.
Bonus: The Range (and Why the Tool Shows It)
Our average calculator also reports the range: the gap between the largest and smallest values.
Range = maximum − minimum
For 4, 8, 6, 5, 7: max = 8, min = 4, range = 8 − 4 = 4 ✓
The range is not an average, but it tells you how spread out the data is — an average of 6 means something very different for {5, 6, 7} than for {1, 6, 11}, even though all three sets share the same mean.
Common Mistakes to Avoid
Forgetting to sort before finding the median. In 3, 1, 7, 5, 9 the unsorted "middle" is 7 — wrong. Sorted, the median is 5. Always sort first.
Dividing by the wrong count. If you add six numbers, divide by six — even if one of them is zero. Zero is a value, not a missing value.
Averaging averages. The average of {class A: 80, class B: 90} is 85 only if the classes are the same size. If class A has 30 students and class B has 10, the real average is (30 × 80 + 10 × 90) ÷ 40 = 3,300 ÷ 40 = 82.5. That is a weighted average problem in disguise.
Quoting the mean for skewed data. "Average house price" in a neighborhood with one mansion is a mean that describes nobody. Ask for the median.
Rounding too early. In multi-step calculations, keep extra decimals until the final answer. Rounding 10 ÷ 3 to 3.3 mid-calculation and then building on it compounds the error.
Quick Reference
| Measure | Formula | Example (4, 8, 6, 5, 7) |
|---|---|---|
| Mean | Sum ÷ count | 30 ÷ 5 = 6 |
| Median | Middle of sorted data | Sorted: 4, 5, 6, 7, 8; middle = 6 |
| Mode | Most frequent value | No mode (all appear once) |
| Weighted mean | Σ(value × weight) ÷ Σ(weights) | Grade example above = 83 |
| Range | Max − min | 8 − 4 = 4 |
Key Takeaways
- The mean (sum ÷ count) is the default "average" and uses every value — but outliers can distort it.
- The median (middle of sorted data) resists outliers; it is the right pick for incomes and prices.
- The mode (most frequent value) is the only average that works on categories like sizes or survey answers.
- When values count unequally, use a weighted average — multiply each value by its weight first.
- Sanity-check every average against the data: if the answer sits outside the min–max range, something went wrong.
Frequently asked questions
What is the formula to calculate average?
The mean (the usual "average") is calculated as: Mean = (sum of all values) ÷ (number of values). Example: for 4, 8, 6, 5, 7 → 30 ÷ 5 = 6.
How do I find the median of a list of numbers?
Sort the numbers from smallest to largest. If the count is odd, the median is the middle number; if even, it is the average of the two middle numbers. Example: 10, 4, 8, 2 → sorted 2, 4, 8, 10 → (4 + 8) ÷ 2 = 6.
What is the difference between mean, median, and mode?
The mean is the sum divided by the count; the median is the middle value of sorted data; the mode is the most frequently occurring value. Use the mean for symmetric data, the median when outliers are present (e.g., incomes), and the mode for the most common category.
When should I use the median instead of the mean?
Use the median when your data is skewed or contains extreme outliers. For example, five salaries of $30k, $35k, $40k, $45k, and $1,000k have a mean of $230k but a median of $40k — the median reflects the typical salary.
How do you calculate a weighted average?
Multiply each value by its weight, add those products, then divide by the sum of the weights. Example: homework 85 (20%), quizzes 90 (30%), exam 78 (50%) → (85 × 0.2) + (90 × 0.3) + (78 × 0.5) = 17 + 27 + 39 = 83.
Can a dataset have more than one mode or no mode at all?
Yes. If two values tie for most frequent, the data is bimodal (e.g., 1, 2, 2, 3, 3, 4 has modes 2 and 3). If every value appears exactly once, there is no mode.
Related guides

How to Split Fair Teams in Seconds
Learn how to split fair teams fast: random draws, even and uneven groups, no-repeat rounds, and when to use a seeded…
Dice Probabilities Made Simple
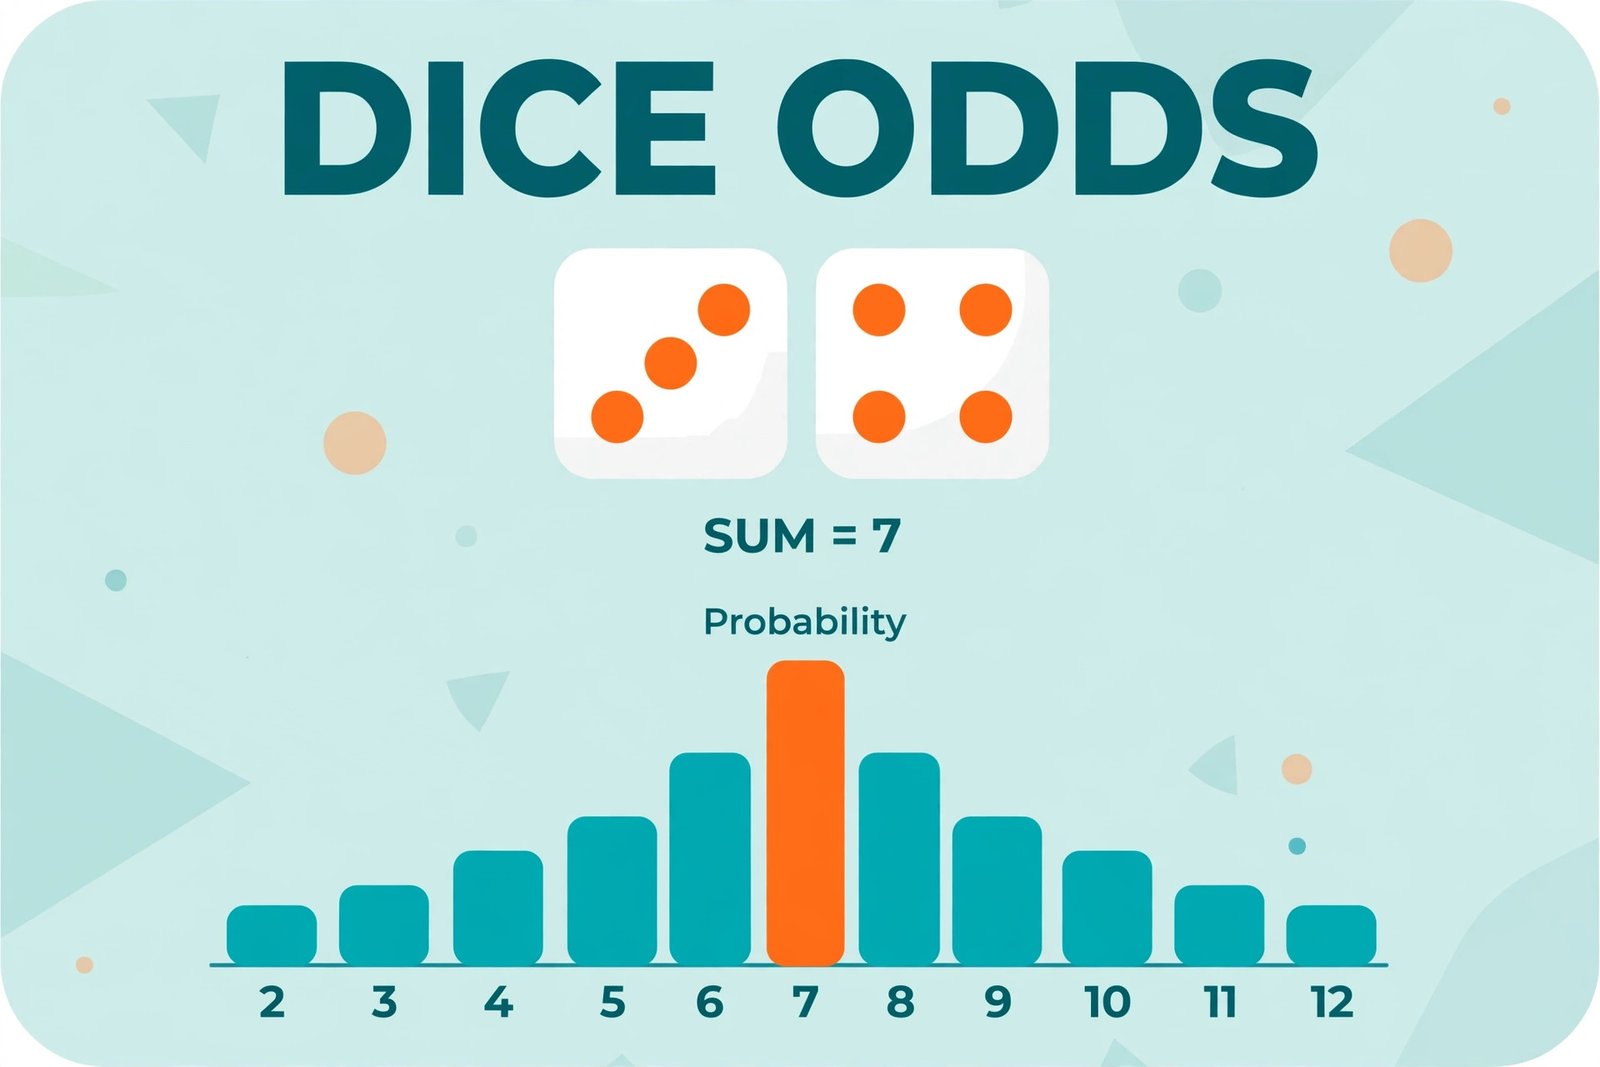
Learn dice probabilities the easy way: one die, two dice, why 7 is most common, and how to use the odds in board games…

How to Make Fancy Text for Bios and Posts
Learn how to make fancy text for Instagram bios, WhatsApp, Discord and TikTok using Unicode styles — plus where fancy…

How to Improve Your Typing Speed (WPM)
Learn how to improve your typing speed with home-row technique, accuracy drills, and a 2-week practice plan. Real WPM…